Somewhere near the end of a documentary, a caption flashes on screen: the only painting Vincent van Gogh ever sold during his lifetime went for 400 francs. The scene cuts away before your brain can process the number. Four hundred francs in 1890 — is that pocket change or a small fortune? Search “inflation calculator” and dozens of tools promise a clean answer: type in an old amount and a year, and a number in today’s money pops out, as neatly as converting Celsius to Fahrenheit.
Except it isn’t that simple, and the people who study this professionally will tell you so without hesitation.
Question
Every general-purpose inflation calculator online works the same way — two numbers in, one number out — which makes it easy to assume there’s a single formula behind the curtain.
Economic historians push back on that assumption immediately. Ask what an old sum is “worth today,” and they answer with a question of their own: worth in what sense? Do you want to know what it would cost to buy the same object today? How long an average worker back then would have needed to labor to earn that sum? Or how large a slice of the entire economy that amount represented? Each of those is a genuinely different question, and different questions about the same 400 francs return wildly different numbers in today’s money. This piece works through what those measures actually are, and why they refuse to collapse into one — using a single Van Gogh painting and the sale of an entire territory as test cases.
Check
Multiple measures aren’t a calculation error — they’re the design
The most widely used conversion tool in this field is MeasuringWorth, built by economic historians Lawrence H. Officer and Samuel H. Williamson. In the paper laying out their methodology, they note that “the popular view is that measuring the ‘worth’ of something over time is a solved problem — unfortunately, it is not.”[1] In a companion explainer on the same site, Williamson and economist Louis P. Cain add that “when you ask what the appropriate measure of worth is for a given commodity, the answer, in most cases, is not one measure but a combination of two or three.”[2] The idea of a single correct answer breaks down right here.
MeasuringWorth’s US-dollar comparison calculator (uscompare) applies exactly that principle, using four base indices.[3]
- Real Price — based on the Consumer Price Index (CPI), this answers “what would it cost to buy that today?” The basis is the purchasing power needed for the same basket of goods.
- Labor Value — based on the average wage (the calculator uses an index of average production-worker earnings), this answers “how many multiples of the average wage would you have had to work to earn that sum?”
- Income Value — based on GDP per capita, this answers “how many multiples of the average person’s income did that amount represent?”
- Economic Share — based on share of GDP, this answers “what fraction of the entire economy’s output did that sum represent?”
The key fact is that labor value, income value, and economic share all rise far faster over the long run than real price (CPI). Wages and GDP tend to grow faster than prices as economies expand and productivity improves. So the further back you go, and the more you switch measures, the gap widens not linearly but exponentially. The two cases below show exactly how much.
Van Gogh’s 400 francs, calculated three different ways
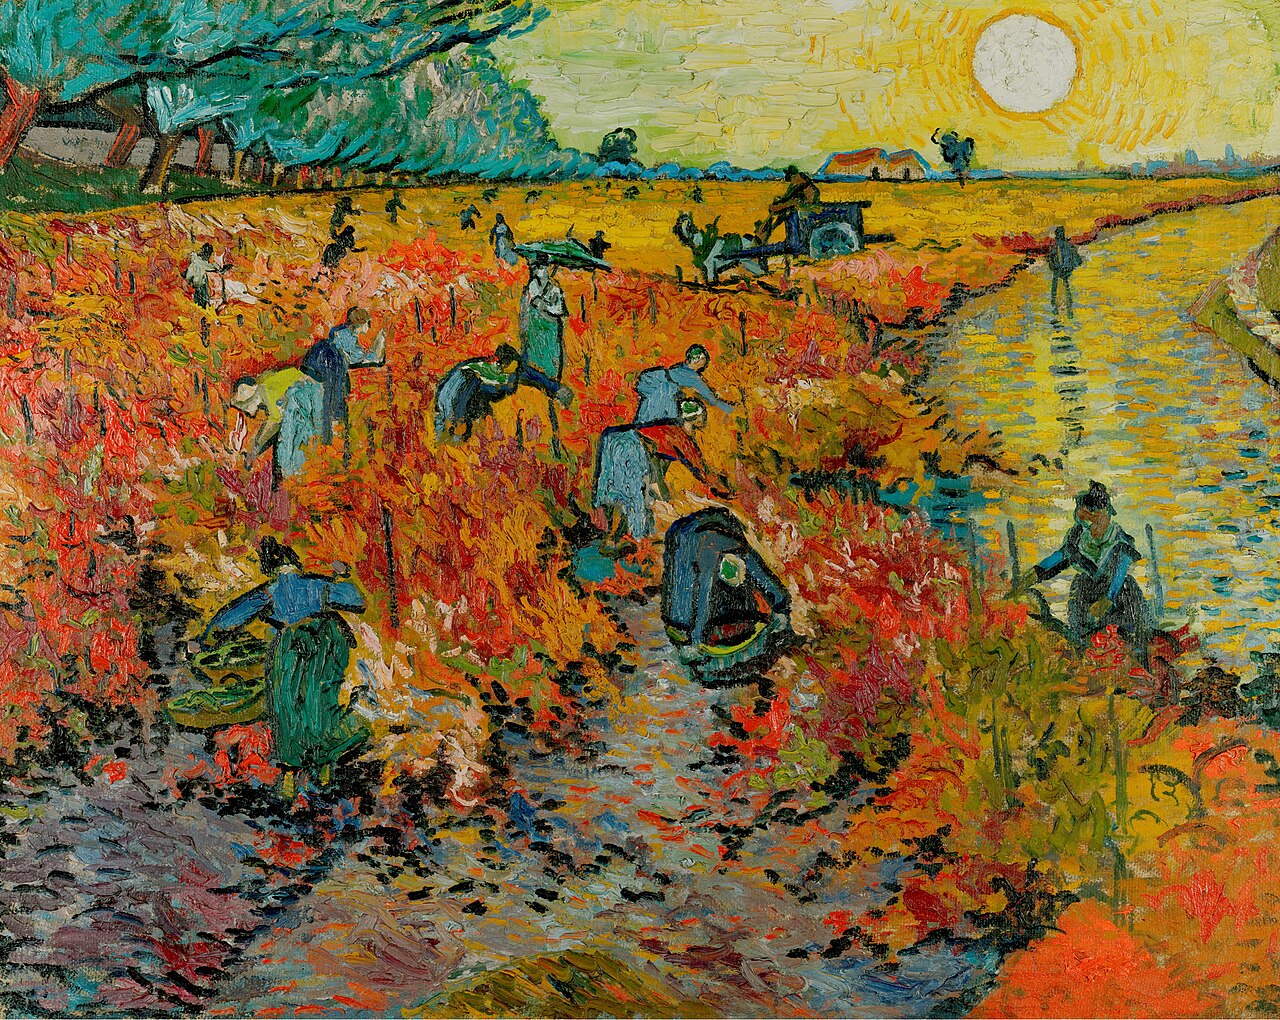
Van Gogh’s The Red Vineyard was shown at the 1890 exhibition of the Brussels artist group Les XX and sold to the Belgian painter and collector Anna Boch for 400 francs — the only sale of his work confirmed to have happened during his lifetime.[4]
.jpg)
Here’s where the problem starts. Converting 1890 francs into today’s dollars first requires converting francs into dollars at all — and the French franc went through two currency reforms in the 20th century. On January 1, 1960, the “nouveau franc” replaced the old franc at a rate of 100 to 1,[5] and on February 17, 2002, the franc was fully replaced by the euro (fixed at 6.55957 francs per euro).[5] Because of those two breaks, there’s no unbroken price index running straight from 1890 francs to today’s euros. So rather than tracking francs on their own index all the way to the present, this piece converts the francs into contemporary dollars using the 1890 gold standard, then runs those dollars through the well-documented US price, wage, and GDP series.
In 1890, France was a member of the Latin Monetary Union (a currency-unification treaty signed on December 23, 1865 by France, Belgium, Italy, and Switzerland), under which one franc was fixed at 0.290322 grams of pure gold.[6] The United States at the time was still a few years from the 1900 Gold Standard Act, but was already effectively on the gold standard; the Act itself specifies that “the dollar consisting of twenty-five and eight-tenths grains of gold nine-tenths fine … shall be the standard unit of value.”[7] Converting grains to grams (1 grain = 0.0648 g) puts one dollar at roughly 1.5046 grams of pure gold.
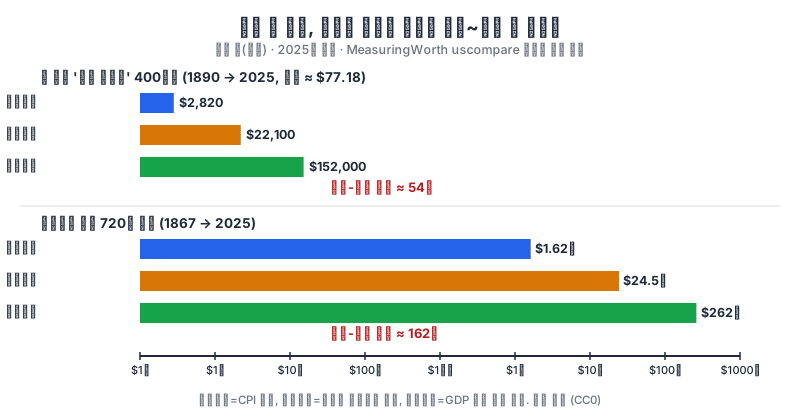
Running that $77.18 through MeasuringWorth’s uscompare calculator, from 1890 to 2025, gives the following (retrieved July 21, 2026).[8]
| Measure | What it answers | 2025 conversion |
|---|---|---|
| Real Price (CPI) | What it would cost to buy the same thing today | $2,820 |
| Labor Value (production-worker wages) | How many multiples of average wage you’d need to work | $22,100 |
| Income Value (GDP per capita) | How many multiples of average income it represented | $28,100 |
| Economic Share (share of GDP) | What percentage of total economic output it represented | $152,000 |
The gap between the lowest value (Real Price) and the highest (Economic Share) is roughly 54-fold. The calculator isn’t malfunctioning. “How much to buy the painting today” and “how much of today’s economy that sum would represent” are different questions from the start, and different questions produce different answers.
Why the $7.2 million Alaska Purchase spreads even wider
Apply the same math to a national-scale transaction, and the gap widens further still. On March 30, 1867, the United States signed a treaty with Russia to purchase Alaska for $7.2 million, with formal transfer completed on October 18 of that year.[9] Running that $7.2 million through the same calculator, from 1867 to 2025, gives this (retrieved July 21, 2026).[10]
| Measure | 2025 conversion |
|---|---|
| Real Price (CPI) | $162 million |
| Labor Value (production-worker wages) | $2.45 billion |
| Income Value (GDP per capita) | $2.72 billion |
| Economic Share (share of GDP) | $26.2 billion |
The low-to-high gap is roughly 162-fold — about three times wider than the Van Gogh case (54-fold). Two things stack up here. One is simply the longer time span: 1867 to 2025 is 158 years, versus 135 years from 1890. If wages and GDP grow even a little faster than prices every year, that difference compounds the longer the span. The other is the nature of the transaction. MeasuringWorth’s own calculator explicitly recommends the Economic Share measure for “the cost of a project” (a program or policy expenditure), noting that “the share of GDP shows the importance of that expenditure relative to the size of the economy.”[3] Buying a single painting is naturally read as “purchasing a good,” but a government buying territory is better understood as a question of “what percentage of the society’s total productive output was committed to this.” By that same logic, the Alaska Purchase tells you more through Economic Share than through Real Price.
The $24 Manhattan deal that never happened
Here the story goes a layer deeper. The most famous number in the “old prices” genre — the claim that the Dutch bought Manhattan from the local Lenape people for $24 — turns out to be shaky before you even get to picking a measure. The original amount itself doesn’t hold up.
The only primary source for this transaction is a letter written on November 5, 1626, in Amsterdam, by Pieter Schagen, an official of the Dutch West India Company. The letter’s full text (in translation) reads: “They have purchased the island Manhattes from the Indians for the value of 60 guilders.”[11] That’s the entirety of what it says. What was traded (beads? tools?), exactly when the deal happened, and with whom — none of that appears anywhere in the letter. The original is held today at the Nationaal Archief in The Hague.[11]
The specific figure of “$24” wasn’t invented until 220 years after the letter resurfaced, when historian E. B. O’Callaghan first coined it in his 1846 book History of New Netherland. O’Callaghan wrote: “received for that splendid tract the trifling sum of sixty guilders, or twenty-four dollars.”[12] That’s simply O’Callaghan’s own conversion using the guilder-to-dollar exchange rate of his own era — the figure “$24” appears nowhere in the 1626 source. Even the famous embellishment that the deal was paid “in glass beads and trinkets” wasn’t added in 1626 or in O’Callaghan’s 1846 book — it was tacked on by historian Martha Lamb in 1877.[12]
In other words, the Manhattan case reveals a problem one step earlier than picking a measure. Before you can even ask “what is this worth today,” you have to ask whether the historical figure was ever really that figure to begin with. Sometimes the number that popular belief cites most confidently turns out, on inspection, to be a later reconstruction.
Why the Big Mac Index can’t help here
When people think “comparing prices across time,” the Big Mac Index often comes to mind. First proposed by The Economist in 1986, it compares the local price of a Big Mac across countries to gauge whether currencies are over- or under-valued relative to purchasing power.[13] But the index was designed from the outset to compare purchasing power at the same point in time, across different countries — it is not a time-series tool for converting one point in time into another (say, 1890 into 2025). The dataset itself only goes back to 1986, so it structurally cannot be applied to anything older.[13] Reaching for the Big Mac Index to solve this problem is a bit like confusing a ruler with a scale: both are measuring instruments, but they measure different things.
The older the era, the more the whole method breaks down
All of this math rests on the assumption that continuous price, wage, and GDP series exist to run the numbers through. But those series themselves start at different points in different countries. The official US Consumer Price Index (CPI-U) is only methodologically comparable back to 1913; everything before that (the 1890s, for instance) relies on academic reconstructions stitched together, such as the Vermont farm cost-of-living index or economist Albert Rees’s cost-of-living index.[14] A currency that broke entirely, as the French franc did, needs the kind of workaround described above just to get a foothold. And once you go back far enough that no such continuous series exists at all — ancient or medieval history, for instance — the question of which measure to pick becomes moot, because the method itself has nothing to run. If a calculator like MeasuringWorth can’t tell you what a Roman denarius is worth today, that isn’t a flaw in the tool. It’s because the thing it would need to measure against — a continuous wage and price record — simply doesn’t exist for that era.
Even “today” resists a single fixed number
Everything so far has been about moving an old amount forward in time. But looked at from a slightly different angle, this difficulty isn’t really about crossing time at all. Even at the same moment, comparing only across countries, a single fixed number turns out to be just as elusive.
Take something as simple as comparing the price of a cup of coffee in New York and in London today. Convert using the bank’s quoted market exchange rate, and you get one number; convert using a purchasing power parity (PPP) exchange rate — one that equalizes actual buying power between the two countries — and you get a different number. The OECD explains that market exchange rates reflect capital flows, policy, and risk premiums, while PPP rates directly compare what the same goods and services actually cost to buy in each country. The two are structurally bound to produce different figures.[15] This is precisely the market-rate-versus-PPP gap that the Big Mac Index itself was built to expose — showing how over- or under-valued a currency is relative to the market rate.[13]
Price indices themselves work the same way. The Consumer Price Index Manual (2020), jointly published by the International Labour Organization (ILO) and the International Monetary Fund (IMF), states that each country’s CPI is built by weighting a “representative consumption basket” based on actual surveys of household spending in that country.[16] But what goes into that basket, and in what proportions, differs by country because household spending patterns differ. Even the single number called “price level,” in other words, already splits apart depending on what a given country treats as standard consumption.
Put together, converting old money into today’s terms isn’t hard merely because a long time has passed. Pinning currency value to a single number is, by design, structurally bound to produce multiple answers — whether you’re crossing time or crossing borders. Van Gogh’s 400 francs is simply the case where that structural difficulty shows up most vividly, under the extreme condition of history.
Fact
There is no single “value today” for old money. Depending on whether you ask about Real Price (CPI), Labor Value (wages), Income Value (GDP per capita), or Economic Share (share of GDP), the same 400 francs becomes $2,820 today — or $152,000. The gap is roughly 54-fold, and for a national-scale transaction (the $7.2 million Alaska Purchase), it widens to 162-fold.[8][10] The calculations aren’t wrong. The four questions were simply different questions from the start.
There’s a sharper twist buried in here too. The most famous number in the “old prices” genre — “Manhattan, bought for $24” — appears nowhere in the 1626 document it supposedly comes from. It was a historian’s own currency conversion of 60 guilders, first written down in 1846, 220 years after the fact.[12] Before you even get to choosing a measure, the original figure itself can turn out to be a reconstruction invented two centuries later. And all of this math only works at all for the modern era, where continuous price and wage statistics survive. If someone asks you to convert the price of a Roman coin into today’s dollars, the most accurate answer is a polite decline.
References
[1]: Lawrence H. Officer and Samuel H. Williamson, “Explaining the Measures of Worth,” MeasuringWorth. https://www.measuringworth.com/explaining_measures_of_worth.php
[2]: Samuel H. Williamson and Louis P. Cain, “Measures of Worth,” MeasuringWorth. https://www.measuringworth.com/defining_measures_of_worth.php
[3]: MeasuringWorth, “Seven Ways to Compute the Relative Value of a U.S. Dollar Amount, 1790 to Present” — definitions of Real Price, Labor Value, Income Value, and Economic Share as shown on the calculator’s results page, including the “Economy Cost” explanation (project expenditures are best understood as a share of GDP indicating social significance). https://www.measuringworth.com/calculators/uscompare/
[4]: The sale of The Red Vineyard to Anna Boch for 400 francs at the 1890 Les XX exhibition in Brussels, and its status as the only sale confirmed during Van Gogh’s lifetime, is corroborated across multiple art-history sources (this refers specifically to the only confirmed sale — it does not rule out the possibility of unconfirmed sales). Wikipedia, “The Red Vineyard” (https://en.wikipedia.org/wiki/The_Red_Vineyard); The Art Newspaper, “How did the only painting sold by Van Gogh in his lifetime end up in Russia?” (Aug. 15, 2025, https://www.theartnewspaper.com/2025/08/15/how-did-the-only-painting-sold-by-van-gogh-in-his-lifetime-end-up-in-russia).
[5]: French currency reforms — the “nouveau franc” introduced January 1, 1960 (replacing the old franc at 100:1), and the euro conversion completed February 17, 2002 (1 euro = 6.55957 francs fixed; euro cash circulation began January 1, 2002). Numiscorner, “The new franc: the story of a reform”; American Numismatic Society, “France: From the Franc to the Euro.” https://www.numiscorner.com/blogs/news/the-new-franc-the-story-of-a-reform
[6]: Latin Monetary Union treaty, signed December 23, 1865 by France, Belgium, Italy, and Switzerland — defining 1 franc = 0.290322 g of pure gold (alongside the 90%-purity 5-franc silver coin standard). Swissgoldsafe, “The Latin Monetary Union”; Wikipedia, “Latin Monetary Union.” https://en.wikipedia.org/wiki/Latin_Monetary_Union
[7]: Gold Standard Act, enacted March 14, 1900 (56th US Congress, 1st Session) — “the dollar consisting of twenty-five and eight-tenths grains of gold nine-tenths fine … shall be the standard unit of value.” Full text in The Statutes at Large of the United States of America, Vol. XXXI, 56th Congress, Session I (Washington: Government Printing Office, 1901), pp. 45-50.
[8]: MeasuringWorth uscompare calculator, direct run of $77.18 (1890) → 2025 (Real Price $2,820 / Labor Value $22,100 / Income Value $28,100 / Economic Share $152,000). Retrieved July 21, 2026. https://www.measuringworth.com/calculators/uscompare/result.php?year_source=1890&amount=77.18&year_result=2025
[9]: US-Russia Alaska cession treaty signed March 30, 1867 ($7.2 million); formal transfer completed October 18, 1867. U.S. Department of State, Office of the Historian, “Alaska Purchase, 1867.” https://history.state.gov/milestones/1866-1898/alaska-purchase
[10]: MeasuringWorth uscompare calculator, direct run of $7,200,000 (1867) → 2025 (Real Price $162,000,000 / Labor Value $2,450,000,000 / Income Value $2,720,000,000 / Economic Share $26,200,000,000). Retrieved July 21, 2026. https://www.measuringworth.com/calculators/uscompare/result.php?year_source=1867&amount=7200000&year_result=2025
[11]: Pieter Schagen, letter dated November 5, 1626 (sent from Amsterdam to the Dutch West India Company) — “They have purchased the island Manhattes from the Indians for the value of 60 guilders.” Original held at the Nationaal Archief (Dutch National Archives, The Hague). Full English translation: Avalon Project, Yale Law School, “Notification of the Purchase of Manhattan by the Dutch; November 5, 1626.” https://avalon.law.yale.edu/17th_century/charter_015.asp
[12]: E. B. O’Callaghan, History of New Netherland; or, New York under the Dutch, Vol. 1 (New York, 1846) — “received for that splendid tract the trifling sum of sixty guilders, or twenty-four dollars.” The “purchased with beads” embellishment was added later by historian Martha Lamb in 1877. Smithsonian National Museum of the American Indian, “America’s first urban myth?” (2011). https://blog.nmai.si.edu/main/2011/08/americas-first-urban-myth.html
[13]: Big Mac Index — created by The Economist in 1986, a same-point-in-time cross-country purchasing power parity (PPP) comparison tool. The official dataset covers only 1986 onward. The Economist, “The Big Mac index”; GitHub, TheEconomist/big-mac-data. https://github.com/TheEconomist/big-mac-data
[14]: The official US Consumer Price Index (CPI-U) is methodologically comparable to the present only from 1913 onward; earlier periods rely on academic reconstructions (e.g., the Vermont farm cost-of-living index, Albert Rees’s cost-of-living index). Federal Reserve Bank of Minneapolis, “Consumer Price Index, 1800-.” https://www.minneapolisfed.org/about-us/monetary-policy/inflation-calculator/consumer-price-index-1800-
[15]: Purchasing power parity (PPP) exchange rates directly compare actual price-level differences between countries, unlike market exchange rates, which reflect capital flows, policy, and risk premiums and can persistently diverge from PPP. OECD, “Purchasing Power Parities - Frequently Asked Questions (FAQs)” (2024). https://www.oecd.org/en/data/insights/data-explainers/2024/06/purchasing-power-parities---frequently-asked-questions-faqs.html
[16]: Each country’s Consumer Price Index is calculated by weighting a “representative consumption basket” based on actual household expenditure surveys in that country, with basket composition and weights differing by country. ILO/IMF, Consumer Price Index Manual: Concepts and Methods (2020), formally endorsed by the UN Statistical Commission (March 4, 2020). https://www.ilo.org/sites/default/files/wcmsp5/groups/public/@dgreports/@stat/documents/publication/wcms_761444.pdf