Leave a full glass bottle of beer, milk, or soda in the freezer a little too long, and the next morning you’ll find it in pieces — sometimes even the plastic bottles split at the seams. All you did was let water get cold. So why does it wreck the container? Everyone already knows the one-line answer: “water expands when it freezes.” But that answer immediately invites two more questions. First, if that expansion could somehow be physically blocked — say, by sealing the water inside a container rigid enough that it simply has nowhere to expand into — would the water just refuse to freeze and stay liquid forever? And second, is this expanding-while-freezing business really something unique to water, or does it happen elsewhere in nature too? Let’s check all three, one at a time, against the primary physics and materials-science literature.
QUESTION
That ice takes up more room than the water it came from is common knowledge. River ice floats. Sea ice floats on the ocean at the poles. Everyone knows this happens because ice is less dense than liquid water.
But that piece of common knowledge tends to grow two more assumptions on top of it. The first is a vague sense that “water is just a weirdly special substance, and that’s why this happens” — popular science writing and casual online explainers routinely present water’s expansion as “almost the only exception among all the materials on Earth.” The second is a question that occurs to anyone who thinks about it for another few seconds: if you could physically block the expansion — say, by sealing water inside an arbitrarily strong steel vessel and cranking up the pressure without limit — would the water have nowhere to expand into, and so just stay liquid forever? Squeezing hard enough to stop the freezing sounds physically plausible.
So there are three things to pin down. First, what is the actual mechanism that makes water’s volume increase when it freezes? Second, is this really a water-only phenomenon, or does it show up in other substances too? Third, what actually happens if you try to block that expansion with pressure? We’ll work through each one using physics and materials-property standards rather than folklore.
CHECK
Why Ice Takes Up More Space Than Water — The Loose Lattice Built by Hydrogen Bonds
A water molecule (H₂O) is one oxygen atom with two hydrogen atoms attached at a bent angle. In liquid water, molecules are tangled together by hydrogen bonds — a weak attraction between the hydrogen of one molecule and the oxygen of a neighboring one — but because the molecules are constantly moving, breaking bonds and forming new ones, the arrangement stays comparatively dense and disordered.
Once the temperature drops below 0°C (32°F) and the water freezes, that changes. Each water molecule locks into hydrogen bonds with exactly four neighboring molecules, arranged in a tetrahedral geometry (imagine two triangular pyramids glued base to base). This four-coordinate “ice rule” was first formalized by J. D. Bernal and R. H. Fowler in 1933,[1] and two years later, in 1935, Linus Pauling used the same structure to quantitatively explain ice’s residual entropy — the leftover disorder in hydrogen positions that persists even at absolute zero — cementing it as the accepted picture in the field.[2] Because every molecule must keep to this rigidly directional, four-bond rule, the molecules can no longer pack together as tightly and randomly as they do in liquid water. Instead they arrange into a hexagonal crystal (commonly called “ice Ih,” ordinary ice) riddled with open hexagonal channels. In short, ice isn’t a tightly packed clump of water molecules — it’s closer to a “loosely built honeycomb,” with gaps left behind because the tetrahedral bonding rule demands them.
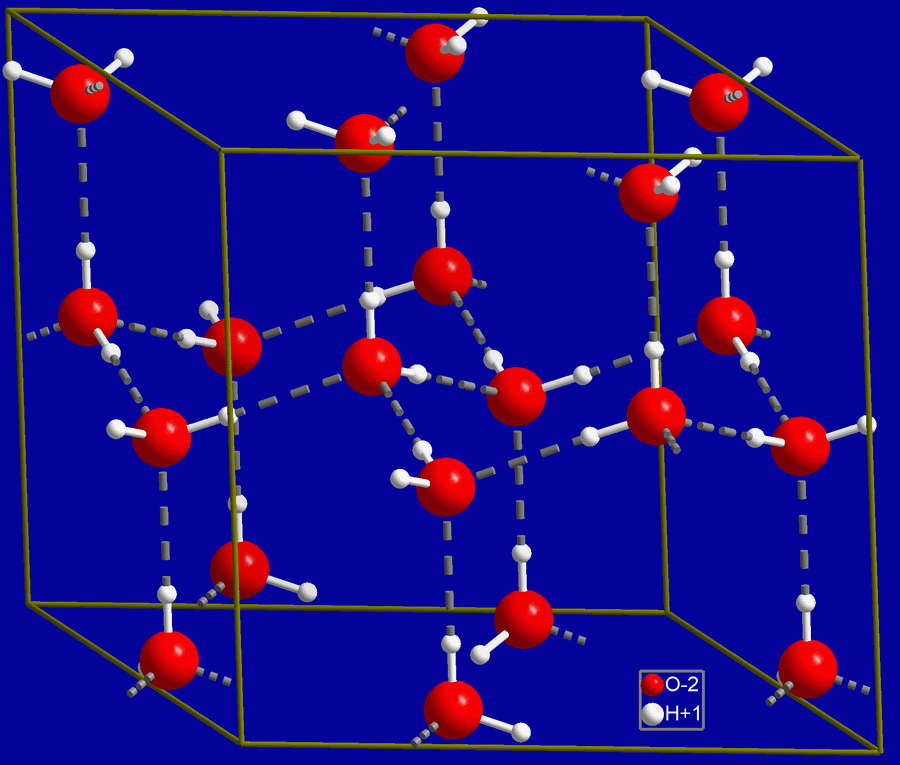

The structural difference shows up in hard numbers too. Per the equation-of-state standard for ice Ih revised in 2009 by the International Association for the Properties of Water and Steam (IAPWS), the density of ice at 0°C (32°F) and 1 atmosphere is 0.9167 g/cm³.[3] Liquid water at that same 0°C, by contrast, has a density of 0.9998 g/cm³.[4] The exact volume increase when a given mass of water freezes falls straight out of the ratio of those two densities.
In other words, the same mass of water grows by about 9.1% in volume when it freezes. That’s where the commonly cited “about 9%” figure comes from. It’s this missing 9% of headroom that cracks glass bottles in freezers and bursts water pipes in winter.

The 4°C (39.2°F) Anomaly — The Loosening Starts Before Water Even Freezes
Water’s strangeness actually starts before it ever becomes ice — while it’s still liquid. Most liquids get steadily denser as they cool, since slower molecular motion lets them pack tighter and tighter, right up until they solidify at the freezing point. Water breaks that pattern: as it cools, its density hits a maximum and then starts dropping again before it ever reaches 0°C. That turning point sits at 3.98°C (39.16°F) at 1 atmosphere, commonly rounded to “4°C” (39°F).[5]
This non-monotonic behavior — density doesn’t just keep rising as the temperature falls — isn’t a coincidence. It’s a preview of the tetrahedral hydrogen-bond structure described above. Cooling water triggers two opposing effects at once. One is ordinary thermal contraction: slower molecular motion pulls molecules closer together. The other is that, as the temperature drops, water molecules increasingly start forming local tetrahedral arrangements — small pockets that resemble the loose structure ice will eventually adopt. Down to 3.98°C (39.16°F), thermal contraction wins out. Below that, the loosening effect from these tetrahedral clusters takes over, and density actually falls.[6] The density peak at 4°C (39°F), then, is really a signal that an ice-like, loosely packed structure is already sprouting inside the liquid, long before any of it has actually frozen.
Is Water Really the Odd One Out? — Other Elements That Rebel Too
At this point it would be easy to conclude that water is nearly the only substance in nature that expands on freezing. That belief is only half right. Among chemical elements alone, at least five — silicon (Si), germanium (Ge), gallium (Ga), bismuth (Bi), and antimony (Sb) — have solid phases that are less dense than their liquid phases. In other words, they too expand in volume when they solidify (the term for a liquid turning into a solid).
The two best-documented cases are bismuth and silicon. An experimental study using radioactive gamma-ray transmission to precisely measure the density of bismuth across the entire condensed range (a term covering both solid and liquid states) found the liquid density near the melting point to be about 10.05 g/cm³, versus roughly 9.73–9.78 g/cm³ for the solid.[7] Converted to a volume-change figure, that works out to roughly 3.3% volume expansion on solidification.[8] It’s this same expansion that makes bismuth useful as a casting additive: alloys containing it don’t shrink as they solidify — they expand slightly and fill the mold completely instead.
Silicon is even more dramatic. A 1959 study in the Journal of Applied Physics measuring silicon’s density near its melting point reported that liquid silicon is about 9±1% denser than solid silicon.[9] Flip that around, and it means silicon actually gets denser (shrinks in volume) when it melts — and correspondingly expands by about that much when it solidifies. This isn’t just a laboratory curiosity; it causes real headaches outside the lab too. In the Czochralski process used to grow single-crystal silicon for semiconductors, molten silicon is poured into a crucible (the vessel holding the melt) and cooled slowly. US patent documentation on the process states that commercial-grade silicon expands roughly 5–8% in volume during this solidification (with electronic-grade silicon expanding even more), cracking and damaging even rigid crucible walls.[10] Germanium, gallium, and antimony show the same directional behavior — solid less dense than liquid — repeatedly confirmed across chemistry and materials-science literature, though this article doesn’t dig into their precise figures.
So “water expands when it freezes” isn’t some absolute uniqueness that belongs to water alone — it’s a property shared by any substance that solidifies while obeying a tetrahedral (or similarly directional) bonding rule. What makes water special isn’t the phenomenon itself. It’s that we happen to experience this particular physical quirk through water more often, and more dramatically, than through anything else in daily life.
What If You Block the Expansion With Pressure? — The Clausius–Clapeyron Answer
That brings us to the third question. If you crush down on the volume expansion of freezing with enough pressure, does water refuse to freeze and just stay liquid?
Answering that requires the standard thermodynamic tool for the relationship between pressure and freezing point: the Clausius–Clapeyron relation. It describes how pressure varies with temperature along the boundary where two phases (solid, liquid, or gas — the different states matter can exist in) coexist in equilibrium.
Here is the entropy change on melting (fusion), and is the volume change on melting.[11] Most substances become looser than their solid form when they melt, so volume increases and ; and melting always increases disorder, so as well. With both terms positive, is positive too — raise the pressure, and the freezing point rises along with it. For most materials, squeezing harder makes them freeze more readily (i.e., at higher temperatures).
Water runs the opposite direction here. When ice melts into water, the volume actually decreases (the reverse of the 9% expansion confirmed earlier), so . The entropy change is still positive, so once you work through the full expression, : raising the pressure actually lowers the freezing point. In practice, water’s freezing point drops by roughly 0.74°C (1.33°F) for every 100 atmospheres (about 10 MPa, or roughly 1,470 psi) of added pressure.[12] Since pressure seems to be actively preventing water from freezing, it would seem, at first glance, to confirm the idea that “pressure can stop ice from forming.”
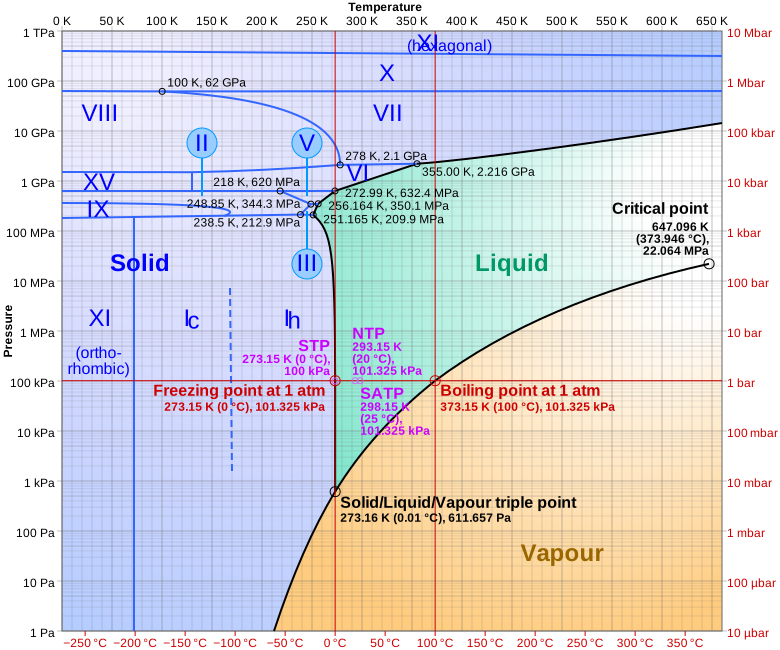
The catch is that this negative slope doesn’t continue indefinitely. The person who first pinned down exactly where it stops was American physicist Percy W. Bridgman. In his 1912 paper “Water, in the Liquid and Five Solid Forms, under Pressure,” he tracked how water’s freezing temperature changed as he kept cranking up the pressure inside a pressure vessel.[13] What he found was that ordinary ice (Ice I, the ice Ih we’re all familiar with) does keep freezing at lower and lower temperatures as pressure rises — right up until a specific point, beyond which water instead solidifies into an entirely different crystal structure: a high-pressure form of ice. Pressure doesn’t “stop” water from freezing. It forces water into becoming a completely different kind of ice.
Exactly where that boundary sits is pinned down with precision in the melting-curve standard revised by IAPWS in 2011. The triple point — where ordinary ice (Ice Ih), the new pressure-formed ice (Ice III), and liquid water all coexist in equilibrium simultaneously (the single, unique temperature-pressure combination at which three phases balance) — sits at exactly 251.165 K (−21.985°C, or −7.573°F) and 2085.66 bar (208.566 MPa, roughly 2,058 atmospheres, or about 30,250 psi).[14] Up to that point, adding more pressure keeps pushing the freezing point lower. But cross it, and water can no longer freeze into ordinary Ice Ih at all. Instead it solidifies into Ice III — a genuinely different crystal arrangement of water molecules.
It’s worth pausing on precision here. Popular science sources often quote this triple-point pressure as “about 210 MPa” or “about 2,072 atmospheres” — figures close to a somewhat older reference value (around 209.9 MPa) that predates IAPWS’s 2011 revision. The current, authoritative IAPWS figure is 208.566 MPa.[14] The gap between the two values — about 1.3 MPa — isn’t large, but in an article whose whole point is pinning down exactly what the correct standard is, the primary-source figure is the one that counts.
What matters most is what happens once you’re past the triple point. Ice III is denser than Ice Ih — denser, in fact, than liquid water itself. Push the pressure higher still, and water runs through a sequence of further phase transitions, from Ice III to Ice V to Ice VI, each of these high-pressure ice phases packing water molecules together more tightly than the last, in its own distinct crystal arrangement rather than the familiar hexagonal one.[15] In other words, above the triple point, adding more pressure doesn’t stop water from freezing — it freezes water into something denser instead. It’s no longer expanding as it freezes; it’s contracting as it freezes. That’s exactly where the idea of “holding off ice with pressure” collapses completely.
FACT
Here’s what’s actually verified. Water expands when it freezes because its molecules can only hydrogen-bond in tetrahedral directions, which forces them into the loose, hexagonal lattice of ordinary ice — and the exact increase, at 0°C (32°F), is about 9.1% (ice at 0.9167 g/cm³, water at 0.9998 g/cm³).[3][4] This isn’t water’s private property: bismuth expands about 3.3% on solidifying,[8] and silicon by roughly 9%.[9] And if you try to block that expansion with pressure, the freezing point genuinely does drop — all the way to the triple point at −21.985°C (−7.573°F) and 208.566 MPa.[14] But past that point, water doesn’t refuse to freeze. It just switches into denser high-pressure forms — Ice III, Ice V, Ice VI — that pack tighter than liquid water itself.
So the fantasy of trapping water in a permanently liquid state with enough pressure collapses at almost exactly 208.566 MPa — nearly 900 times the pressure in a car tire (about 33 psi, or 0.23 MPa). Cross that threshold, and pressure stops giving water any slack at all. It just decides what shape the ice takes. And the claim that “water is one of a kind” turns out to be similarly half true and half false. Silicon cracks crucibles as it solidifies; bismuth swells as it hardens. What’s unusual about water isn’t the physics — it’s that we’re the ones who feel that physics play out, every single time we open the freezer door.
References
[1]: J. D. Bernal and R. H. Fowler, “A Theory of Water and Ionic Solution, with Particular Reference to Hydrogen and Hydroxyl Ions,” Journal of Chemical Physics 1, 515 (1933) — first formalized the tetrahedral (four-coordinate) hydrogen-bonding rule for water molecules (the “ice rule”)
[2]: Linus Pauling, “The Structure and Entropy of Ice and of Other Crystals with Some Randomness of Atomic Arrangement,” Journal of the American Chemical Society 57, 2680–2684 (1935) — quantitatively explained the disordered hydrogen positions and residual entropy of ice Ih
[3]: IAPWS, R10-06(2009), “Revised Release on the Equation of State 2006 for H2O Ice Ih,” https://iapws.org/documents/release/Ice-2009 — gives ice Ih density of 0.9167 g/cm³ at 0°C and 1 atm (original paper: R. Feistel and W. Wagner, J. Phys. Chem. Ref. Data 35(2), 1021–1047, 2006)
[4]: G. S. Kell, “Density, Thermal Expansivity, and Compressibility of Liquid Water from 0° to 150°C,” Journal of Chemical and Engineering Data 20(1), 97–105 (1975) — standard reference value of 0.9998 g/cm³ for liquid water at 0°C
[5]: Kell (1975), same as above — reports water’s density maximum at 3.98°C at 1 atm; independently confirmed by the IAPWS-95 equation of state (W. Wagner and A. Pruß, J. Phys. Chem. Ref. Data 31(2), 387–535, 2002)
[6]: The link between liquid water’s local tetrahedral clustering and its density anomaly is a widely covered qualitative explanation in standard physical chemistry literature, with the density-temperature data of Kell (1975) and Wagner & Pruß (2002) as its quantitative basis
[7]: S. V. Stankus, R. A. Khairulin, A. G. Mozgovoi, V. V. Roshchupkin, and M. A. Pokrasin, “An Experimental Investigation of the Density of Bismuth in the Condensed State in a Wide Temperature Range,” High Temperature (Springer) 43(3), 368–378 (2005), DOI: 10.1007/s10740-005-0075-7 — measured bismuth density across 337–1505 K using radioactive gamma-ray transmission; reports liquid density of about 10.05 g/cm³ and solid density of about 9.73–9.78 g/cm³ near the melting point
[8]: Volume-expansion figure (about 3.3%) converted from the density values above. This 3.3% figure is also a standard number repeatedly cited in materials-engineering literature on bismuth’s casting and alloying properties
[9]: “Density Change in Silicon upon Melting,” Journal of Applied Physics 30(3), 322 (AIP Publishing) — direct measurement of solid and liquid silicon density near the melting point, reporting a 9±1% density increase on melting (equivalently, the same percentage of volume expansion on solidification)
[10]: US Patent 4,045,536, “Method of Casting Bismuth, Silicon and Silicon Alloys” — states that commercial-grade silicon expands roughly 5–8% in volume on solidification (electronic-grade silicon more), and identifies this expansion as the direct cause of cracking in rigid molds and crucibles
[11]: The Clausius–Clapeyron relation is a standard thermodynamic relationship covered in physical chemistry textbooks (e.g., P. Atkins, Physical Chemistry), expressing the pressure-temperature slope of a phase boundary in terms of the entropy and volume change of the transition
[12]: The pressure dependence of water’s freezing point (about a 0.74°C drop per 100 atmospheres) is a standard approximation obtained by substituting water’s measured fusion entropy and volume change into the Clausius–Clapeyron relation, repeatedly cited across physical chemistry literature
[13]: P. W. Bridgman, “Water, in the Liquid and Five Solid Forms, under Pressure,” Proceedings of the American Academy of Arts and Sciences 47(13), 441–558 (1912) — the first experimental study to establish water’s phase transitions under high pressure. JSTOR: https://www.jstor.org/stable/20022754
[14]: IAPWS, R14-08(2011), “Revised Release on the Pressure along the Melting and Sublimation Curves of Ordinary Water Substance,” https://iapws.org/documents/release/MeltSub — fixes the Ice Ih–Ice III–liquid triple point at 251.165 K (−21.985°C), 2085.66 bar (208.566 MPa)
[15]: The crystal structures and phase boundaries of high-pressure ice forms (Ice III, V, VI, etc.) follow the IAPWS R14-08(2011) melting-curve standard above and the phase-transition framework established by Bridgman (1912), subsequently refined by extensive high-pressure physics research